Tuesday, June 9, 2009

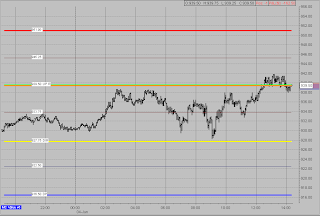
Mid Cap 400 - CORRECTIVE


The JUN’09 MID CAP400 is stuck in a corrective trade and will remain vulnerable to a re-test of yesterday low area at 583.70-583 with all trading below the 596.80 Inflection Pivot.

This is the expected low point for the digestive range if the underlying positive momentum is going to keep pace. A held failure from 583.00 confirms further corrective action targeting 558.30 and 552.10 on any sentiment shift. Expect no follow through at this time.

A rise above the 596.80 Inflection Pivot and the aggressive buying returns targeting new moves highs up to 615.60 and 619.80 initially. 638.70 is the extneded target for any new leg higher.


JS

Thursday, June 4, 2009

FAZ as an event hedge for the SP500 Index


FAZ AS AN EVENT HEDGE

The FAZ Financial Bear 3x is a short-term [read Daily rebalancing] timing tool that can be used as a hedge for a potential event day.

With Employment numbers released tomorrow and the SP500 Index at a major inflection pivot [945] the FAZ can be a good value “insurance” bet.

Buying the FAZ this afternoon or near the close and exiting tomorrow or Monday’s close.

The SP500 JUN’09 contract is currently keying off the 945 and 962.50 Inflection Pivots. Buying the FAZ on a 1 and 2 unit size ratios, 1 unit at 945 and 2 units when the SPM’09 is at 962.50.

If the recent rally is going to fizzle and turn sour it will do so off either of these inflection points and if so put the Index back in a vulnerable position with the potential to put the lower Bear trend pattern back in play for a revisit to the April’09 lows at the 780 area. Not in the session mind you but as a psychological sentiment shift that this could be so, with the expectations displayed in the price of the FAZ.

A rise above 962.50 and the Index will have another 40-50pts in it for a challenge to the 1010 level. This will be another opportunity to buy FAZ, as even a small reaction here should pay for any losses incurred on the original FAZ buys. Consider using the 3.5pt stop at each SP M’09 inflection point for any FAZ buys. Each inflection pivot level can be used with a REVERSAL strategy if stopped out as well as any violation of resistance should be sustained and hold structure if the MKT is good.

Looks like a 1 to 8 risk reward, which it should be as this is a counter trend FADE.

Insurance is not cheap but this has the potential to make something for you.

945, 962.50 and 1010 Inflection pivots. 1 unit, 2 unit and 3 unit respective opportunities. Remember the FAZ rebalances each day so pushing a position beyond a couple sessions is too much.

The best option is to use the JS Services Price Map each day to isolate the key session inflection points to leverage opportunity in the FAZ.


For more information please contact me at info@jsservices.com

JS

BRITISH POUND - Applied Strategy Based Trading

BRITISH POUND – Initial Target Attained

In my May 20, 2009 post, with the JUN’09 BRITISH POUND contract trading at the 15663 Inflection Pivot, I highlighted a positive divergence signal with a 16633 initial target.

Impressive day in the British Pound.

15663 is the Inflection Pivot to key off for the current advance. If the MKT is going to run it should just go with 16363 and 16633 the initial targets
.

Today the MKT attained that target.

By using the Price Map you optimized your position by not only locking in your gains but were also presented an opportunity to get short.

The service is published at 12am cst and highlighted the MKTs technical position to be “BULL TREND EXTREME”. In this technical state the MKT is extended and an exhaustive reaction is expected.


At 1am cst the MKT was at our forecasted target, which was also today’s UP [Upside Pivot or Resistance Inflection Pivot]. With the technical posture exhaustive, taking profits at 16634 was the only option. If you were not on the MKT, a resting overnight order was a nice wake up call.


But the day is just getting started and on the right foot. On the regular session open the Price Map produces a negative signal below the DIR [16542] providing a sell opportunity. Additionally a failure from the 16420 DP [Downside Pivot or Support Inflection Pivot] provides another sell signal with two opportunities to enter and attaining the 16266 DT2 [Downside Target #2].

This is a classic Price Map BREAKOUT strategy. Where the MKT breaks outside the UP-DP Critical Range extremes.

The original May 20, 2009 post signal was valid for a 1000 point move. The Price Map enhanced this with another 800-point winner on the reverse.

This is the power of Strategy Based Trading.

Aligning your strategy with the market expectations.

Today JS Services Technical Outlook was BULL TREND EXTREME. Our expectations are for an exhaustive reversal or digestive trade. Combining this with our long term forecast target we can anticipate a negative reaction and accept exhaustive Reversal and Breakdown Failure signals.

By using the sell bias Price Map entry strategies at risk qualified inflection points we can systematically exploit this opportunity.

By anticipating opportunity we capture it.

For more information regarding Strategy Based Trading and the Price Map please contact me.

JS

BRENT CRUDE OIL - Position Management Using the Price Map

BRENT CRUDE – Initial Target Attained

In my May 21, 2009 post when the JUL’09 BRENT CRUDE OIL Contract was trading @ $59 the expectation was for a rally up to $68 or $74 oil. Today the contract topped out at $68.65, after a reversal signal and potential short-term top.

The rally may or may not be over but by incorporating JS Services Price Map and MarketColor analysis into your trading plan for this opportunity you would have improved your performance and reduced any profit give-back by exiting or establishing a hedge to your long position at the $66.35 level.

Here is how.


JS Services is published each trading session at 12am(cst). In the June 2, 2009 Brent Crude Oil release the service defines the MKTs Technical Ste in its Highlight Comment, which today was “BULL TREND EXTREME”.

In a BULL TREND EXTREME technical posture expectations are for either an exhaustive reversal or digestion.

The Price Map defines the key Inflection Points for the session with the UP [Upside Pivot] being the key resistance point to key off.


In today’s early action the MKT produced a REVERSAL signal off this Inflection Point confirming our expectations for a sell opportunity.

At the regular session opening the MKT produced another negative signal breaking structure below the DIR [Directional level] and then confirmed that break in structure by failure from the DP [Downside Pivot].

Will the negative signal follow through or is today’s action just a pause for the cause? No one knows but the Price Map will allow you to capture the opportunity whatever the direction.

JS

Tuesday, June 2, 2009

NIKKEI 225 - DECISION DAY


The NIKKEI 225 JUN’09 is pressing major directional resistance at the 9830 extreme above the 9710 Inflection Pivot posted on May 25, 2009.

If the recent run is going to fizzle and fall back into a digestive trade it will do so against the 9830 resistance. If it does reject, a turn back to the 9490 support is the immediate outlook, with the potential of sending the Index down to 9340 in the near term.

A held breach of 9830 and things start to get interesting with 10510 the initial target for the next leg higher.

Bottom line for today, the MKT is pressing the upper extreme and is either going to reject back into a neutral digestive posture or accelerate the current advance.

NASDAQ 100 - REACHING

1522 Inflection Pivot

The NASDAQ100 JUN'09 Contract is reaching and looks set for one more exhaustive push, setting up a short-term opportunity for today. If we do get another surge expectations are that the rise will exhaust either at 1499 or 1522 Inflection Pivot. Look for Reversal strategies off the 1499 resistance and be more aggressive at 1522, especially if we get a press into this area early in the session.

The outlook is for more of a big digestive trade rather than a reversal. Good opportunity to buy a put spread as an emotional trade has the potential to heat up volatility for a short-term opportunity.

A break under 1430 is needed to signal a pause in the aggressive buying, targeting 1384 on any negative turn. Be patient. If the Index is going to build a base for another advance it will do so from here. If not the contract is vulnerable to a sharp drop back down to the 1338-1336 support area. No follow through is expected at this time.

JS

Friday, May 29, 2009

USDJPY - Hedge Strategy Practical Application


Risk Management Strategies Using Inflection Pivots

Inflection Pivot analysis is a guide to the psychological landscape of a market, identifying price points where shifts in sentiment will occur. These points of inflection can be used for directional trading opportunity as well as the basis of a hedge or risk management program.

Referring to the May 26, 2009 post regarding the USDJPY cross rate.

A Japanese Corporate uses YEN [JPY] to buy U.S. Dollars [USD] to purchase US goods or receives USD for goods sold and needs to convert the USD to JPY to pay employees and shareholders. The fluctuations of the conversion rate can have a significant impact on the corporate bottom line if this is not managed properly.

To protect itself from the currency fluctuations the Corporate will hedge its exposure by taking an opposing trade to their underlying position. So if they are net long JPY and will need to pay USD for goods [LONG JPY/ SHORT USD] they will put on an opposite trade [SHORT JPY / LONG USD] to lock in a “guaranteed rate” that they can then use to base their cost analysis on.

This hedge is a form of insurance. Insurance can be expensive.

To reduce costs the Corporate may not always be hedged and will assume an acceptable variance of cross rate risk and only hedge significant “worst case” shifts. How is this acceptable variance derived and what constitutes “worst case”? This is basically an internal risk management overlay of what “works” for the corporate risk appetite.

In addition to any transaction cost there is an additional “opportunity cost”. If the USD depreciates this will be a good thing as the cost of goods to purchase will be less, basis JPY. By hedging out the adverse affects of cross rate volatility we also exclude the positive effects.

So how can we use inflection pivot analysis to improve a hedge strategy.

On May 26, 2009 the Inflection Pivot Blog outlined parameters for a hedge strategy.

Assuming we are net LONG JPY verses the USD. Our position is vulnerable to an increase in the USDJPY. A hedge would be to go long the USDJPY. The question is, are we at risk and if we are where do we buy?

From the analysis we read:

The USDJPY is trying to transition into a positive position and will maintain this posture above the 9355-9340 Inflection Pivot.

Our position is vulnerable as the MKT is above the 9355 Inflection Pivot and we should consider a hedge immediately with the expectation of the USDJPY appreciating.

If the MKT is good it will stabilize above here. A breach of 9670 is encouraging however a violation of the 9971 Resistance Inflection Pivot is needed to signal a positive acceleration in momentum targeting 10697 and 11272-11235 on the move.

Reading further into the work our initial risk is up to 9971 in the USDJPY. Potentially this is the high point of an acceptable variance. Trading above 9971 however and we are risk for a much more significant price move up to 11272. If we are not long already, we should definitely go long USDJPY above this inflection point to hedge our position.

A break under 9277 and the USDJPY revisits the 8715 recent low point where buying should be expected. A test of this support is negative however and positive reactions should be considered opportunities to FADE.

A failure from the 8715 support inflection pivot will extend the weakness down to the 8030-7830 support band. Look for buying opportunities in this zone as no immediate follow through is expected and the outlook a 3-5 month digestive rally out of this zone.

In summary from the Inflection Pivot analysis we should only become comfortable with the cross rate going in our favor below 9277 and at this time remove any hedge, as expectations are that the USDJPY will drop down to 8715 if not the 8030 area. If our expectations are correct we should consider applying a hedge in the 8030 area to lock in a favorable rate, as an appreciation of the USDJPY is the outlook from this support base.

The Inflection Pivot work can be used to manage an outright long position in the USDJPY or for the construction of option-spread positions using the inflection pivot points as strike price levels.

By defining significant psychological points of inflection we put structure to random price action and provide a framework to create hedge strategies that anticipate shifts in market sentiment and price.

For more information please contact me directly at info@jsservices.com.

JS