BRENT CRUDE OIL fell just shy of the resistance target published in the May 21,2009 post.
Is that it?
The MKT had a nice rebuke but it is too early to tell if the underlying positive momentum is at risk. Reactions should always be expected at major areas of inflection. This reaction for now is keeping the buyers honest with their leverage. Expect the 68.00 area to be pivotal. Only under 66.60 does sentiment shift negative target the 58.80-58.40 support band initially.
If the MKT is bad it should just go. Any digestive action is a positive signal. A breach of 71.43 is a sign that the MKT wants to make another run at the 74.10 target resistance area if not 78.90.
JS
This commentary supports JS Services Strategy Based Trading approach.For more information please contact me at info@jsservices.com. You can also visit http://www.jsservices.com/.* The Inflection Pivot levels are available as a chart overlay on the following platforms; Ninja trader, Strategy Runner and eSignal. Sign up for a Complimentary Trial.
Tuesday, June 30, 2009
Monday, June 29, 2009
CRUDE OIL - What's UP with that?
What’s up with CL?
The AUG’09 CRUDE OIL contract closed firm and is flirting with further gains.
Key off the 70.85 Inflection Pivot today for an indication of the session’s tone. Above here the buyers will remain aggressive pressing resistance at 72.27 and 72.77. Be patient. If the momentum is going to fizzle it will here. A held violation confirms a positive breakout signal targeting 74.80 on the initial push. 76.20 and 77.50 are the extended targets for any new leg north.
CRUDE OIL Q'09 DAILY
A break under 70.85 and the MKT is vulnerable to more difficult choppy digestive action down to the 67.33-66.90 support band. This is the base supporting any new consolidation if the positive momentum is going to pick back up. A break under this support inflection negates the underlying positive sentiment putting the 63.00 level in play.
JS
This commentary supports JS Services Strategy Based Trading approach.For more information please contact me at info@jsservices.com. You can also visit http://www.jsservices.com/.* The Inflection Pivot levels are available as a chart overlay on the following platforms; Ninja trader, Strategy Runner and eSignal. Sign up for a Complimentary Trial.
Thursday, June 25, 2009
SP 500 - Positive Signal Technical Signal
The SP500 closed firm posting a positive technical signal and will keep an aggressive buy posture above 901 targeting 928.50 on any new interest today. A breach of 919.25 confirms this forecast.
894.50 is the Inflection Pivot for Friday June 26, 2009.
Above 894.50 breaks are buying opportunity. Only under yesterday’s low at 891 is the MKT back on the defensive and threatening down to 873 and 868.50.
931.25-928 is the lid for any follow through to today’s positive signal. Be patient. If the corrective trade of late is going to continue the MKT will reject here. A Daily close or sustained breach of 928.75 and the momentum is expected to accelerate to new move highs at 962.50.
The confluence between the Indices continued on Thursday June 24, 2009 with the ND100 taking the lead. Notice the ND100 rejecting from its resistance pivot [UP – Upside Pivot] at 12noon when the SP500 was trying to bust of its Critical Range violation at 910.50.
Price Map Chart Overlay for June 25, 2009
SP500 Index
Expect the confluence to continue with the SP500 taking the lead today.
Is the MKT really that strong that Monday’s negative signal could not even press into support or is it just house cleaning after the roll. Most likely we will have to wait till next week to find out.
JS
Is the MKT really that strong that Monday’s negative signal could not even press into support or is it just house cleaning after the roll. Most likely we will have to wait till next week to find out.
JS
This commentary supports JS Services Strategy Based Trading approach.
For more information please contact me at info@jsservices.com. You can also visit http://www.jsservices.com/.
* The Price Map levels are available as a chart overlay on the following platforms; Ninja trader, Strategy Runner and eSignal. Sign up for a Complimentary Trial.
For more information please contact me at info@jsservices.com. You can also visit http://www.jsservices.com/.
* The Price Map levels are available as a chart overlay on the following platforms; Ninja trader, Strategy Runner and eSignal. Sign up for a Complimentary Trial.
SP500 - Confluence Indicator
The SP500 had a messy session after breaking out above Wednesday’s 895.25 Inflection Pivot. The MKT is transitioning back into a neutral position with the Weekly resistance area at 931-928 the digestive lid.
Thursday’s, 6/25/2009, action will focus on the 910.50 – 902.00 Critical Range. This is the area of indecision today with the current positive momentum maintaining the controls above 902. A break under this support pivot is needed to bring back the sellers putting the 870.00 target back in play and the contract vulnerable to a negative sentiment shift.
A rise above 910.50 and the positive momentum does its best to impress with the 919.50 and 929 resistance targeted. Look for exhaustive sell signals. No follow through is expected at this time.
Wednesday provided a key indicator of confluence in both the DOW Futures and ND100 for the SP500. Note the 10am highs in all three indices. When the SP500 violated its resistance both the ND100 and DOW did not.
SP500 Index
DOW Futures Index
DOW Futures Index
The DOW proved to be the best barometer of the late weakness as it rejected from it’s session Inflection Pivot [R Level] and produced a REVERSAL signal under it’s resistance pivot [UP – Upside Pivot] prior to the late sell off in the SP500.
Watch for confluence signals again today. If the markets are going to make a move they will be in sync. If not it is more likely going to be a choppy re-run of Wednesday.
This commentary supports JS Services Strategy Based Trading approach.
For more information please contact me at info@jsservices.com. You can also visit http://www.jsservices.com/.
JS
* The Price Map levels are available as a chart overlay on the following platforms; Strategy Runner, Ninja Trader and eSignal. Sign up for a Free Trial.
Tuesday, June 23, 2009
SP500 - Is that it?
The SEP’09 SP500 contract found it’s footing after Monday’s negative signal but will it be enough to turn the index back north.
As always anything is possible however when the MKTs technical state is taken into consideration we have a few more clues to it's intentions.
Tuesday, June 23, 2009 action is a good case in point. JS Services defines a MKTs technical state and the inflection points in which it will react in its daily Price Map. Pre-market Tuesday’s service advised that the MKT was in a NEUTRAL CORRECTIVE technical state.
NEUTRAL CORRECTIVE TECHNICAL STATE
Typical action in this technical state is choppy with sharp breaks against the underlying trend with the best opportunities to FADE weakness into support. Tuesday’s action provided a sharp break down to the daily Price Map support pivot and bounced, with the balance of the session sideways chop.
The market performed to expectation today and the daily Price Map allowed you to capture it.
Note Tuesday’s R level [Inflection Pivot] at 902-901.75 coincides with this week’s directional point [6/22/2009 post]. As a position management tool of Monday's negative signal this would be a good point for a trail stop. In addition the 884.00 Support Pivot [DP] provided an opportunity to “work” the trade and realize some profits. Expectations in a NEUTRAL CORRECTIVE state are that the sharp breaks will produce positive reactions, especially if those breaks happen above a major support inflection pivot.
So what’s next in the SP500 U'09 contract for Wednesday June 24, 2009?
Tuesday’s sideways higher session produced a NEUTRAL POSITIVE EXTREME signal. In this technical signal state the MKT is pressing it’s upper digestive extreme and will either snap back into a negative posture or transition higher after breaking through it’s extreme or today's Inflection Pivot.
895.25 is the Inflection Pivot to key off for the session.
Below this price point the Index will remain hard pressed targeting 878.50 and 870.50 on any new weakness in the session, keeping Monday's negative signal in play. Expectations are that emotions will start to escalate however it’s just that above 862.50. Only under the 862.50 Weekly support inflection pivot does the underlying sentiment shift negative. Keep your eye on the 3457 in the VIX to gauge the fear factor.
A rise above the 895.25 Inflection Pivot puts Monday’s negative signal on hold for a challenge to the 903.50-902 Weekly directional area. How the MKT reacts here will provide a clue to the action for the next couple days. A rejection and the Bears will be back on the prowl searching for support. A violation and the positive momentum will have the 931.25-926.25 resistance band in its sights.
This posts supports JS Services Strategy Based Trading approach.
For more information please contact me at info@jsservices.com. You can also visit http://www.jsservices.com/.
JS
Monday, June 22, 2009
SP500 - How low can you go?
The SP500 U’09 contract has started the week on the defensive and is searching for support.
How low can it go? Or more precisely how low can it go and not alter the underlying positive sentiment off the March’09 lows? - 862.50.
Expectations for this week are that as long as the MKT is below the 931 Inflection Pivot it is vulnerable to further corrective action target, 878, 870 and 862.50 on the extreme. If the current weakness is going to stabilize it is doubtful that the MKT will do much if any trading below 870 and will more likely bounce above 878. Any positive reaction out of the 878-862.50 are will have the 9312.25-929 as the week’s target resistance. REVERSAL strategies are recommended to capture any positive turn.
Currently (1:15pm cst June 22, 2009) the Index will remain hard pressed below 902 targeting support. This Directional level will be a good gauge of momentum between the 931 and 970 inflection pivots.
A break under 962.50 is needed to confirm any sentiment shift off the MAR’09 lows. If so expectations are for volatility to pick up [use the 3457 level in the VIX as a sentiment guide and a violation of 4031 as the confirmation point that the fear factor is back] with 778.00 the initial target.
If the MKT stabilizes above 878-870 expectations for the week should be for a run at the 931-929 Inflection Pivot area with 902 acting as a sentiment gauge for any relief from today’s negative shift. This is a FADE opportunity as further sideways to lower action is the outlook. Only above 931 does the positive momentum engage targeting 963 initially. The likely environment will be stop and go however if the rally does extend it can climb up to 1017.
This Inflection Pivot forecast is for the week ending June 26,2009 and is supported by JS Services Daily Price Map overlay analysis.
For more information please contact me at info@jsservices.com. You can also visit http://www.jsservices.com/.
John Slazas
For a complimentary daily Price Map trial to please click here http://www.jsservices.com/Authentication/freeTrialRequest.asp
Friday, June 19, 2009
BKX - BTK Negative Correlation
Flip Flop
BKX - DOWNTREND CORRECTIVE - BUY SIGNAL
BTK - UPTREND CORRECTIVE - SELL SIGNAL
JS Services Strategy Alerts are design to have impact for the trading session. As in any major signal however they do have the potential to be the start of something bigger. Yesterday’s ACCELERATION Signals are such signals.
Today however the dynamics have changed but the symmetry in the signals between these two sectors has not.
The BKX has a positive corrective signal today with yesterday’s rally. The rally is corrective and the integrity of our 3703 Inflection Pivot remains intact. As long as this is so the sector is vulnerable to a return to the negative posture. A Daily close above 3703 will negate this opportunity and confirm the corrective signal and a return to a sideways digestive trade.
The BTK did follow through on its acceleration signal attaining our initial target at 674.49 but lost some indicator support in the process and hence the negative corrective signal. Beware of early strength into the 683.50. As mentioned this is major overhead and with today’s negative signal a reaction should be expected. This MKT may be best left alone today as a messy trade is likely.
Two sectors going opposite directions. Two opposing strategy expectations. Technical trade balance.
For more information please contact me at info@jsservices.com and visit http://www.jsservices.com/
JS
Two sectors going opposite directions. Two opposing strategy expectations. Technical trade balance.
For more information please contact me at info@jsservices.com and visit http://www.jsservices.com/
JS
Thursday, June 18, 2009
BKX - KBW Bank Sector vs BTK - Biotechnology Index
BKX / BTK an unusual pair.
BKX - DOWNTREND ACCELERATION - SELL SIGNAL
BTK - UPTREND ACCELERATION - BUY SIGNAL
The BKX - KBW Bank Sector Index has a negative signal for today, which will remain in play below the 3703 Inflection Pivot, targeting 3383 on any negative follow through. If this signal is the spark to a new move south the 3030 price point is the extended target. 3703 is the ideal sell point today, however any sell signal is valid below here with risk parameters constructed using 3383 as the target objective.
The BTK - Biotechnology Sector Index produced a positive signal which will remain in force above the 652.32 Inflection Pivot, targeting 674.49 and 683.50. 683.50 is a Resistance Inflection Pivot that is expected to contain an new positive push. Expect a reaction. Only above here can the rally breach the Feb'09 highs. Breaks above 652.32 are buying opportunities, with a break under the June 16 649.31 low needed to negate the positive signal. Use 674.49 as the target to construct trade off this risk.
Two sectors going opposite directions. Two opposing strategy expectations. Technical trade balance.
For more information please contact me at info@jsservices.com and visit http://www.jsservices.com/
JS
Tuesday, June 16, 2009
GOLD - NEUTRAL DIGESTIVE
In the Inflection Pivots Blog I'm posting JS Services Strategy Alerts. These signals are meant for the session but certain signal types will have greater influence for a longer term move.
The Saturday June 13, 2009 post identified a DOWNTREND ACCELERATION SELL SIGNAL. This is a breakout signal that had potential but only influenced the MKT for the day attaining the initial target.
The algorithm produced a DOWN TREND CORRECTIVE BUY signal for Tuesday's action as noted in Monday nights post with the expectation of a sideways to higher trade for the session. The MKT performed to expectation and remained within JS Services Critical Range extremes.
So now what?
There is no technical technical signal today but JS Services is defining the current technical state as NEUTRAL DIGESTION. Expectation today should be for a sideways trend less trade in this environment.
Based on the prior two sessions signals however we can refine our expectation. Monday GOLD had a Negative Trend Acceleration signal that was immediately followed by a Corrective Buy signal on Tuesday. The MKT did close higher on Tuesday but did not violate Monday's key Inflection Pivot at 948 nor could it close above the 938.8 Directional level defined in the post for Tuesday's trading keeping the MKT in a vulnerable position.
So for today's session the technical state is NEUTRAL DIGESTIVE, however the MKT remains vulnerable to a negative turn below the 945 Inflection Pivot. A breach of this level is needed to negate Monday's negative signal and confirm the neutral state.
This MKT is technical on the fence and should make a decision to its direction today or tomorrow.
The expectation is sideways but negative below 945.
By defining the MKTs technical state we can align our trading strategies with our expectations.
For more information please contact me at info@jsservices.com and visit http://www.jsservices.com/
JS
Monday, June 15, 2009
GOLD - Technically in play
GOLD - Practical application position management
This past weekend's Down Trend Acceleration SELL signal followed through and attained the initial minimum target at 929.6. The MKT remains in play. Although the contract did not provide an ideal entry opportunity at our 948 inflection pivot it did provide an opportunity based on the type of technical signal that was in play.
By understanding the MKTs technical state we can align our strategies to capitalize on it. JS Services traders understand this and know that in a Down Trend Acceleration SELL signal our expectations are for the negative action to hold structure and continue to produce lower move lows and lower highs.
The early morning rally just before 8am cst had the MKT challenging Sunday evenings high structure. With the MKT unable to attain the initial 929.6 target overnight and our expectations of the MKT to hold negative structure, FADING price action against the Sunday night highs was a good bet with risk defined using 929.6 as a profit target.
A better way to position manage this opportunity is to subscribe to JS Services Price Map technical levels, http://www.jsservices.com/Authentication/freeTrialRequest.asp.
Today's GOLD Price Map had traders anticipating a sell opportunity at 938.8 with confidence as not only was the structure of the technical state in favor of a sale but the MKT was also challenging the session's Directional Inflection Pivot.
What's next? Well today our algorithm is producing a Down Trend Corrective BUY signal. Expectations today should be for a sideways to higher corrective trading environment with the potential for the MKT resuming the negative trend on any offer. BUY strategies are valid but profits should be taken sooner than later and for now the positive action is against underlying negative momentum. The best strategy today will be a SELL REVERSAL off a resistance level with the expectation that the 915.2 target will be back in play.
If the positive corrective signal is going to be negated and a resumption of the negative momentum is going to happen today, it is unlikely any corrective rally will breach the 948 inflection pivot. In addition if the downtrend is going to stay on course the MKT should close under the 938.8 level . If not our sell signal will most likely transition into a Neutral position with 962 and 966 targeted.
For more information please contact me at info@jsservices.com and visit http://www.jsservices.com/
JS
Saturday, June 13, 2009
GOLD - DOWNTREND ACCLERATION SELL SIGNAL
Inflection Pivots act as triggers to market movement. The movement is sparked by fundamental and technical shifts. JS Services statistical indicator produces signals that highlight technical shifts. These signals produce a directional probability bias for the session but as in any signal have the potential to be the start of something much bigger.
By combining these signal alerts with qualified Inflection Pivots we can quantify our risk and capture opportunity.
Today we have a NEGATIVE technical signal in GOLD. This has us accepting sell signals off qualified Inflection Pivots in the AUG’09 Contract. This is an alert to accept sell signals not to blindly sell.
As subscribers to JS Services Price Map you have access to the complete inflection pivot overlay. In this commentary I will highlight a few key points to consider, 948 and 962.
948 is the Inflection Pivot for the session. If the negative signal is going to stay aggressive any positive reaction will reject here. A held violation of the 948 level does not negate the negative signal but does set up a rally to sell up to the 967-962 resistance band. Both 948 and 962 represent the best risk reward qualified entry points for today’s negative GOLD signal.
The current minimum support target levels for any downside follow through for the negative signal is 929.6 and 915.2. These price targets should be your expectation today for any sales and your risk adjusted as such. If the MKT has yet to attained a target the better the sell opportunity is.
This may be all the opportunity we get to the downside and today’s negative signal may just be a head fake before the positive momentum resumes course. The GOLD MKT is at a turning point however and today’s signal does have the potential to be the straw that turns sentiment negative targeting 850. Whichever way the drama unfolds the Inflection Pivots will script the story.
In Summary
The technical signal tells us that the GOLD MKT is in play. Qualified price inflection pivots provide entry areas where our risk can be defined. Support and resistance targets allow you to “see” what the opportunity is so as “live” MKT dynamics shift you can capitalize on them with the bigger picture in mind.
Will the MKT give us an opportunity off our Inflection Pivot? That remains to be seen, but if the opportunity presents itself it is a place where your risk can be defined by a couple dollars for the potential to make $20-$40 if not a $100.
Please contact me directly with any questions, info@jsservices.com or visit http://www.jsservices.com/ for a complimentary trial of our Price Map overlay.
JS
Tuesday, June 9, 2009
USDCHF - SELL DAY
The USDCHF is on the defensive and threatening to roll-over.
If the MKT is going to continue to work yesterday's aggressive sell posture any rally will reject off the 10828 Inflection Pivot. A rise above this point is expected to be all smoke and mirrors with 10849 or 10872 the high point for the show. Accept sell signals in this zone and leverage up if the MKT provides some good structure to manage the risk. More than 20min above 10872 and the negative signal is negated.
10727 is the support level which the MKT should stabilize off it is going to bounce back into a digestive trade. A failure here has the potential to be the start of something biggerwith 10639 and 10577 the immediate target.
If sentiment is really turning the 10040 area is the extended outlook.
JS
Mid Cap 400 - CORRECTIVE
The JUN’09 MID CAP400 is stuck in a corrective trade and will remain vulnerable to a re-test of yesterday low area at 583.70-583 with all trading below the 596.80 Inflection Pivot.
This is the expected low point for the digestive range if the underlying positive momentum is going to keep pace. A held failure from 583.00 confirms further corrective action targeting 558.30 and 552.10 on any sentiment shift. Expect no follow through at this time.
A rise above the 596.80 Inflection Pivot and the aggressive buying returns targeting new moves highs up to 615.60 and 619.80 initially. 638.70 is the extneded target for any new leg higher.
JS
Thursday, June 4, 2009
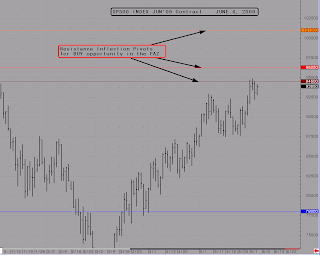
FAZ as an event hedge for the SP500 Index
FAZ AS AN EVENT HEDGE
The FAZ Financial Bear 3x is a short-term [read Daily rebalancing] timing tool that can be used as a hedge for a potential event day.
With Employment numbers released tomorrow and the SP500 Index at a major inflection pivot [945] the FAZ can be a good value “insurance” bet.
Buying the FAZ this afternoon or near the close and exiting tomorrow or Monday’s close.
The SP500 JUN’09 contract is currently keying off the 945 and 962.50 Inflection Pivots. Buying the FAZ on a 1 and 2 unit size ratios, 1 unit at 945 and 2 units when the SPM’09 is at 962.50.
If the recent rally is going to fizzle and turn sour it will do so off either of these inflection points and if so put the Index back in a vulnerable position with the potential to put the lower Bear trend pattern back in play for a revisit to the April’09 lows at the 780 area. Not in the session mind you but as a psychological sentiment shift that this could be so, with the expectations displayed in the price of the FAZ.
A rise above 962.50 and the Index will have another 40-50pts in it for a challenge to the 1010 level. This will be another opportunity to buy FAZ, as even a small reaction here should pay for any losses incurred on the original FAZ buys. Consider using the 3.5pt stop at each SP M’09 inflection point for any FAZ buys. Each inflection pivot level can be used with a REVERSAL strategy if stopped out as well as any violation of resistance should be sustained and hold structure if the MKT is good.
Looks like a 1 to 8 risk reward, which it should be as this is a counter trend FADE.
Insurance is not cheap but this has the potential to make something for you.
945, 962.50 and 1010 Inflection pivots. 1 unit, 2 unit and 3 unit respective opportunities. Remember the FAZ rebalances each day so pushing a position beyond a couple sessions is too much.
The best option is to use the JS Services Price Map each day to isolate the key session inflection points to leverage opportunity in the FAZ.
For more information please contact me at info@jsservices.com
JS
BRITISH POUND - Applied Strategy Based Trading
BRITISH POUND – Initial Target Attained
In my May 20, 2009 post, with the JUN’09 BRITISH POUND contract trading at the 15663 Inflection Pivot, I highlighted a positive divergence signal with a 16633 initial target.
Impressive day in the British Pound.
15663 is the Inflection Pivot to key off for the current advance. If the MKT is going to run it should just go with 16363 and 16633 the initial targets.
Today the MKT attained that target.
By using the Price Map you optimized your position by not only locking in your gains but were also presented an opportunity to get short.
The service is published at 12am cst and highlighted the MKTs technical position to be “BULL TREND EXTREME”. In this technical state the MKT is extended and an exhaustive reaction is expected.
At 1am cst the MKT was at our forecasted target, which was also today’s UP [Upside Pivot or Resistance Inflection Pivot]. With the technical posture exhaustive, taking profits at 16634 was the only option. If you were not on the MKT, a resting overnight order was a nice wake up call.
But the day is just getting started and on the right foot. On the regular session open the Price Map produces a negative signal below the DIR [16542] providing a sell opportunity. Additionally a failure from the 16420 DP [Downside Pivot or Support Inflection Pivot] provides another sell signal with two opportunities to enter and attaining the 16266 DT2 [Downside Target #2].
This is a classic Price Map BREAKOUT strategy. Where the MKT breaks outside the UP-DP Critical Range extremes.
The original May 20, 2009 post signal was valid for a 1000 point move. The Price Map enhanced this with another 800-point winner on the reverse.
This is the power of Strategy Based Trading.
Aligning your strategy with the market expectations.
Today JS Services Technical Outlook was BULL TREND EXTREME. Our expectations are for an exhaustive reversal or digestive trade. Combining this with our long term forecast target we can anticipate a negative reaction and accept exhaustive Reversal and Breakdown Failure signals.
By using the sell bias Price Map entry strategies at risk qualified inflection points we can systematically exploit this opportunity.
By anticipating opportunity we capture it.
For more information regarding Strategy Based Trading and the Price Map please contact me.
JS
BRENT CRUDE OIL - Position Management Using the Price Map
BRENT CRUDE – Initial Target Attained
In my May 21, 2009 post when the JUL’09 BRENT CRUDE OIL Contract was trading @ $59 the expectation was for a rally up to $68 or $74 oil. Today the contract topped out at $68.65, after a reversal signal and potential short-term top.
The rally may or may not be over but by incorporating JS Services Price Map and MarketColor analysis into your trading plan for this opportunity you would have improved your performance and reduced any profit give-back by exiting or establishing a hedge to your long position at the $66.35 level.
Here is how.
JS Services is published each trading session at 12am(cst). In the June 2, 2009 Brent Crude Oil release the service defines the MKTs Technical Ste in its Highlight Comment, which today was “BULL TREND EXTREME”.
In a BULL TREND EXTREME technical posture expectations are for either an exhaustive reversal or digestion.
The Price Map defines the key Inflection Points for the session with the UP [Upside Pivot] being the key resistance point to key off.
In today’s early action the MKT produced a REVERSAL signal off this Inflection Point confirming our expectations for a sell opportunity.
At the regular session opening the MKT produced another negative signal breaking structure below the DIR [Directional level] and then confirmed that break in structure by failure from the DP [Downside Pivot].
Will the negative signal follow through or is today’s action just a pause for the cause? No one knows but the Price Map will allow you to capture the opportunity whatever the direction.
JS
Tuesday, June 2, 2009
NIKKEI 225 - DECISION DAY
The NIKKEI 225 JUN’09 is pressing major directional resistance at the 9830 extreme above the 9710 Inflection Pivot posted on May 25, 2009.
If the recent run is going to fizzle and fall back into a digestive trade it will do so against the 9830 resistance. If it does reject, a turn back to the 9490 support is the immediate outlook, with the potential of sending the Index down to 9340 in the near term.
A held breach of 9830 and things start to get interesting with 10510 the initial target for the next leg higher.
Bottom line for today, the MKT is pressing the upper extreme and is either going to reject back into a neutral digestive posture or accelerate the current advance.
NASDAQ 100 - REACHING
1522 Inflection Pivot
The NASDAQ100 JUN'09 Contract is reaching and looks set for one more exhaustive push, setting up a short-term opportunity for today. If we do get another surge expectations are that the rise will exhaust either at 1499 or 1522 Inflection Pivot. Look for Reversal strategies off the 1499 resistance and be more aggressive at 1522, especially if we get a press into this area early in the session.
The outlook is for more of a big digestive trade rather than a reversal. Good opportunity to buy a put spread as an emotional trade has the potential to heat up volatility for a short-term opportunity.
A break under 1430 is needed to signal a pause in the aggressive buying, targeting 1384 on any negative turn. Be patient. If the Index is going to build a base for another advance it will do so from here. If not the contract is vulnerable to a sharp drop back down to the 1338-1336 support area. No follow through is expected at this time.
JS
Subscribe to:
Posts (Atom)