The US Equity Indices continued to climb higher but may be in for a reality check today. The Nasdaq100 is pressing into the extreme but the MidCap400, SOX, XBD and the DAX have produced fresh positive signals. These along with a few other markets are technically "in play" after producing a BULL TREND ACCELERATION signals.

The following markets have produced a positive signal and will continue to work an aggressive buy posture above their session Inflection Pivot.
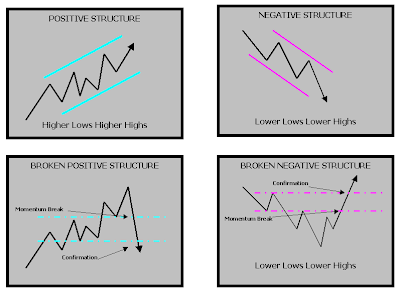
BULL TREND ACCELERATION
NOVEMBER 12, 2009 - MKT - Inflection Pivot
MidCap400 Z'09 - 690.30
DAX Z'09 - 5611
SOX - Semiconductor Sector Index - 31300
XBD - Broker Dealer Index - 11686
Japanese Yen Z'09 - 9432
EURGBP - FOREX - 8995
Soybeans F'10 - 957-6
Draw a line on your intra-day chart at these levels. Look for opportunity in the direction of the Inflection Pivot price bias. Executing at or near these price points will provide the best risk / reward. If the MKT cannot follow through on its signal and produces a REVERSAL signal at its Inflection Pivot, a sharp counter signal move should be expected.
Good trading.
JS
STRATEGY BASED TRADING Review http://progressive.powerstream.net/008/00102/edu/interactive/js_services/strategy_based_trading/index.html
For more information please contact me at info@jsservices.com. You can also visit http://www.jsservices.com/.The Inflection Pivot levels are available as a chart overlay on the following platforms; Ninja trader, Strategy Runner and eSignal. Sign up for a Complimentary FREE Trial.


 This is the power of strategy based trading, aligning your expectations with the MKTs current technical state. Your expectation in a BEAR TREND ACCELERATION technical state is that the MKT is going to “fall out of bed”. If this does not play out and the signal is “invalid” a counter positive reaction should be expected. The price point that defines this sentiment shift is what I call the Inflection Pivot.