Thursday, November 5, 2009

BEAR TREND ACCELERATION REVIEW - SWISS FRANC Z'09

NOV 4 2009 REVIEW
On Nov 4th 2009 the Swiss Franc Dec'09 futures contract was in a BEAR TREND ACCELERATION technical state.

The Inflection Pivot that defined that technical state was defined as 9767.

Expectations are that if the negative signal is going to follow through the MKT will remain below the price point. A rise above this price and sentiment shifts.

A BEAR TREND ACCELERATION technical state is an excited state. The MKT is fearful, almost in a panic. Any positive turn out of that state will be a big “relief” and buyers will scramble to “rebalance” sometime sparking a sharp advance.

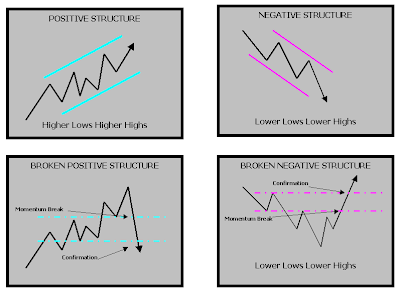
This is what played on in the SWISS FRANC Z’09 yesterday. The MKT could not follow through on its technical signal and after a breach in the negative structure a sharp rally was produced.

The Inflection Pivot defines structure to the current technical state. In BEAR TREND ACCELERATION it is the turning point from “aggressive sell” to “buy”. The market produced a negative signal. The signal was false and a counter positive reaction from the false negative signal should be expected.

This is the power of strategy based trading, aligning your expectations with the MKTs current technical state. Your expectation in a BEAR TREND ACCELERATION technical state is that the MKT is going to “fall out of bed”. If this does not play out and the signal is “invalid” a counter positive reaction should be expected. The price point that defines this sentiment shift is what I call the Inflection Pivot.

Hope this helps.

Good trading.

JS

If you would like to receive JS Services Inflection Pvot analysis as a chart overlay like below please contact me at info@jsservices.com. Sign up for a Complimentary FREE Trial.
SWISS FRANC Z'09 Price Map Chart Overlay Nov 4, 2009 performance


STRATEGY BASED TRADING Review http://progressive.powerstream.net/008/00102/edu/interactive/js_services/strategy_based_trading/index.html

Tuesday, November 3, 2009

SWISS FRANC Z'09 - BEAR TREND ACCELERATION

The focus remains on MKTs that have produced a major negative signal or BEAR TREND ACCELERATION signal. This is a negative signal that should accelerate the current downside momentum if valid.

For November 4, 2009 only the Swiss Franc Dec'09 futures have produced a BEAR TREND ACCELERATION signal.


Swiss Franc Z'09 9767 Inflection Pivot


The question, is does this signal have potential or was yesterday's signal just a 1 day event. The price point to key off that keeps the MKT in an aggressive sell posture is the 9767 Inflection Pivot. This is the price point that defines the technical state from being an aggressive sell posture below that price point to a potential reversal or digestive trade above that price point.

If the MKT is bad it should hold below 9767 and press the 9697 initial support level. If we are in for a digestive session the contract will stabilize here. A held failure confirms yesterday's negative signal targeting 9627 on any release. 9487 is the current extreme.


A held rise above 9767 takes the edge off the currency for a difficult trade up to 9802 with the potential of going as high as 9837 in the session. No follow through is expected. Only above 9837 does sentiment shift projecting the MKT up to 9977.

Draw a line on your intra-day chart at these levels. Look for opportunity in the direction of the Inflection Pivot bias. Executing at or near these price points will provide the best risk / reward.


JS


STRATEGY BASED TRADING Review http://progressive.powerstream.net/008/00102/edu/interactive/js_services/strategy_based_trading/index.html


For more information please contact me at info@jsservices.com. You can also visit http://www.jsservices.com/.The Inflection Pivot levels are available as a chart overlay on the following platforms; Ninja trader, Strategy Runner and eSignal. Sign up for a Complimentary FREE Trial.
The Strategy Based Trading approach is the focus on the applied strategy over a specific market.


Again today we are going to focus on MKTs that have produced a major negative signal BEAR TREND ACCELERATION. This is a negative signal that should accelerate the current downside momentum if valid.


The question, is does this signal have potential or was yesterday's signal just a 1 day event. The price point to key off that keeps the MKT in an aggressive sell posture is the session Inflection Pivot. This is the price point that defines the technical state from being an aggressive sell posture below that price point to a potential reversal or digestive trade above that price point. Trading below the session Inflection Pivot has the MKT in an aggressive sell posture and the BEAR TREND ACCELERATION signal in play. Trading above this price point is an indication that the negative vulnerability of the MKT is reduced and there is a better chance of a sharp positive push or a firm digestive trade.


If the negative signal is good you should expect the market to hold negative structure. If not may be time for a turn.


November 3, 2009


Below are the MKTs that have produced a BEAR TREND ACCELERATION signal and the Inflection Pivot that determines the continuation of the sell signal or not.


EQUITY FUTURES [DEC09]


MidCap400 667.30


FOREX


EURCHF 15118


Draw a line on your intra-day chart at these levels. Look for opportunity in the direction of the price bias. Executing at or near these price points will provide the best risk / reward.


If the current price is above the Inflection Pivot in this technical state, market sentiment is saying "prove it to me that the negative signal is valid". If the MKT cannot break under the Inflection Pivot the likely hood that the negative signal was just a 1 day event is high with the potential for a counter signal rally.


If the Inflection Pivot is above the current price then the negative signal is still in play "up" to that price point. Any lower sales are not "wrong" unless the MKT is above the Inflection Pivot and sell signals below this point should be taken.


JS


STRATEGY BASED TRADING Review http://progressive.powerstream.net/008/00102/edu/interactive/js_services/strategy_based_trading/index.html


For more information please contact me at info@jsservices.com. You can also visit http://www.jsservices.com/.The Inflection Pivot levels are available as a chart overlay on the following platforms; Ninja trader, Strategy Runner and eSignal. Sign up for a Complimentary FREE Trial.

Sunday, November 1, 2009

BEAR TREND ACCELERATION Signals: SP500, ND100, DOW Futures, DAX, FTSE100

The Strategy Based Trading approach is the focus on the applied strategy over a specific market.

Today we are going to focus on MKTs that have produced a major negative signal BEAR TREND ACCELERATION. This is a big negative that should accelerate the current downside momentum if valid. The question, is does this signal have potential or was yesterday's signal just a 1 day event. The price point to key off that keeps the MKT in an aggressive sell posture is the session Inflection Pivot. This is the price point that defines the technical state from being an aggressive sell posture below that price point to a potential reversal or digestive trade above that price point.


Trading below the session Inflection Pivot or what JS Services calls its REVERSAL LEVEL or R Level has the MKT in an aggressive posture and the BEAR TREND ACCELERATION signal in play. Trading above this price point is an indication that the negative vulnerability of the MKT is reduced and there is a better chance of a sharp positive push of firm digestive trade.


November 2, 2009

Below are the MKTs that have produced a BEAR TREND ACCELERATION signal and the Inflection Pivot that determines the continuation of the sell signal or not.


EQUITY FUTURES [DEC09]


SP500 1033.25
Dow Fut 9850
Nasdaq100 1710.75

DAX 5612.0
FTSE100 5102


Draw a line on your intra-day chart at these levels. Look for opportunity in the direction of the price bias. Executing at or near these price points will provide the best risk / reward.

If the current price is above the Inflection Pivot in this technical state, market sentiment is saying "prove it to me that you're bad". If the MKT cannot break under the Inflection Pivot the likely hood that the negative signal was just a 1 day event is high with the potential for a counter signal rally. If the Inflection Pivot is above the current price then the negative signal is still in play "up" to that price point. Any lower sales are not "wrong" unless the MKT is above the Inflection Pivot and sell signal below this point should be taken.

JS

STRATEGY BASED TRADING Review http://progressive.powerstream.net/008/00102/edu/interactive/js_services/strategy_based_trading/index.html

For more information please contact me at info@jsservices.com. You can also visit http://www.jsservices.com/.The Inflection Pivot levels are available as a chart overlay on the following platforms; Ninja trader, Strategy Runner and eSignal. Sign up for a Complimentary FREE Trial.

Wednesday, October 28, 2009

Today's BEAR TREND ACCELERATION Signals

The Strategy Based Trading approach is the focus on the applied strategy over a specific market. Define a strategy that you are comfortable with and apply that strategy in MKTs whose technical state is in line with your strategy criteria.

Today we are going to focus on MKTs that have produced a major negative signal BEAR TREND ACCELERATION. This is a big negative that should accelerate the current downside momentum if valid. The question, is does this signal have potential or was yesterday's signal just a 1 day event. The price point to key off that keeps the MKT in an aggressive sell posture is the session Inflection Pivot. This is the price point that defines the technical state from being an aggressive sell posture below that price point to a potential reversal or digestive trade above that price point.

Trading below the session Inflection Pivot or what JS Services calls its REVERSAL LEVEL or R Level has the MKT in an aggressive posture and the BEAR TREND ACCELERATION signal in play. Trading above this price point is an indication that the negative vulnerability of the MKT is reduced and there is a better chance of a sharp positive push of firm digestive trade.

October 29, 2009

Below are the MKTs that have produced a BEAR TREND ACCELERATION signal and the Inflection Pivot that determines the continuation of the sell signal or not.

EQUITY FUTURES [DEC09]

SP500 1051.75

Dow Fut 9702

Nasdaq100 1672.25


CURRENCIES

Canadian Dollar z'09 9341

AUDUSD FOREX 9020

EURGBP FOREX 9003

Draw a line on your intra-day chart at these levels. Look for opportunity in the direction of the price bias. Executing at or near these price points will provide the best risk / reward.

If the current price is above the Inflection Pivot the the current sentiment is like "prove it to me". If the MKT cannot break under the Inflection Pivot the likely hood that yesterday's signal day was a 1 day event and the potential for a corrective rally is high. If the Inflection Pivot is above the MKT then the negative signal is in play "up" to that price point. Any lower sales are not "wrong" unless the MKT is above the Inflection Pivot and sell signal below this point should be taken.

JS

STRATEGY BASED TRADING Review http://progressive.powerstream.net/008/00102/edu/interactive/js_services/strategy_based_trading/index.html

For more information please contact me at info@jsservices.com. You can also visit http://www.jsservices.com/.The Inflection Pivot levels are available as a chart overlay on the following platforms; Ninja trader, Strategy Runner and eSignal. Sign up for a Complimentary FREE Trial

Tuesday, October 27, 2009

Entry Strategies

Execution Strategies off a qualified price point or Inflection Pivot take the form of 3 basic techniques, defined as either a FADE, BREAKOUT or REVERSAL.

The following webvideo http://www.jsservices.com/education/sbt/CME_EntryStrategies5min.wmv goes over an entry strategy technique in the ND100 Index.

JS

Sunday, October 25, 2009

BULL TREND CORRECTION: SP500, ND100, DOW30, AUDUSD, CORN, GOLD

Today we are going to focus on MKTs that have produced a negative signal against an underlying positive trend or a BULL TREND CORRECTION signal state.

The question, is this negative signal going to follow through or is this just a 1 day event and the underlying positive momentum is going to resume. The price point that answers this question and determines this "sentiment shift" is the session Inflection Pivot. This is the price point that defines the technical state from being a negative "corrective"posture below that price point to a positive BULL TREND position above that price point.

For OCTOBER 26, 2009 all markets that have produced a BULL TREND CORRECTIVE signal are CURRENTLY above their Inflection Pivot. In this situation the Inflection Pivot is basically saying "prove it to me". If the market is bad it should break below the Inflection Pivot and not look back. A held trade above this price keeps the market in a firm digestive trade.

Today I have added an additional price level, a resistance pivot or Upside Pivot. This is the price point where the positive underlying trend should be expected to resume. Each level should be drawn on an intra-day chart for a visual presentation of opportunity. Trading above the Inflection Pivot keeps the market firm however a resumption of the BULL TREND is not confirmed until the market is above the Upside Pivot. This application is available for automatic updates in following platforms: Strategy Runner, Ninja Trader and eSignal. Click here for a Complimentary FREE Trial.

EQUITY FUTURES [DEC09]

SP500 1056.75 Inflection Pivot : Upside pivot 1082.50

Nasdaq100 1716.50 Inflection Pivot : Upside Pivot 1779.50

Dow Futures 9927 Inflection Pivot : Upside Pivot 10029

FOREX

AUDUSD 9201 Inflection Pivot : Upside Pivot 9277

Commodity [Dec' 09]

CORN 389-0 Inflection Pivot : Upside Pivot 408-0

Metals [Dec'09]

GOLD 1043.7 Inflection Pivot : Upside Pivot 1069

Draw a line on your intra-day chart at these levels. Look for opportunity in the direction of the Inflection Pivot price bias. Executing at or near these price points will provide the best risk / reward. SELL BREAKOUT below the Inflection Pivot as well as BUY REVERSAL on a false breakdown signals are opportunity. SELL FADE against the Upside Pivot expecting the negative signal to continue or BUY BREAKOUT entry strategies above the Upside Pivot should be considered expecting the BULL TREND to resume.


Good Trading.

JS
Strategy Based Trading is a methodology that focuses on the applied strategy verses a specific market and looks to align strategies with markets whose current technical behavior matches the strategies criteria.


For more information please contact me at info@jsservices.com. You can also visit http://www.jsservices.com/.